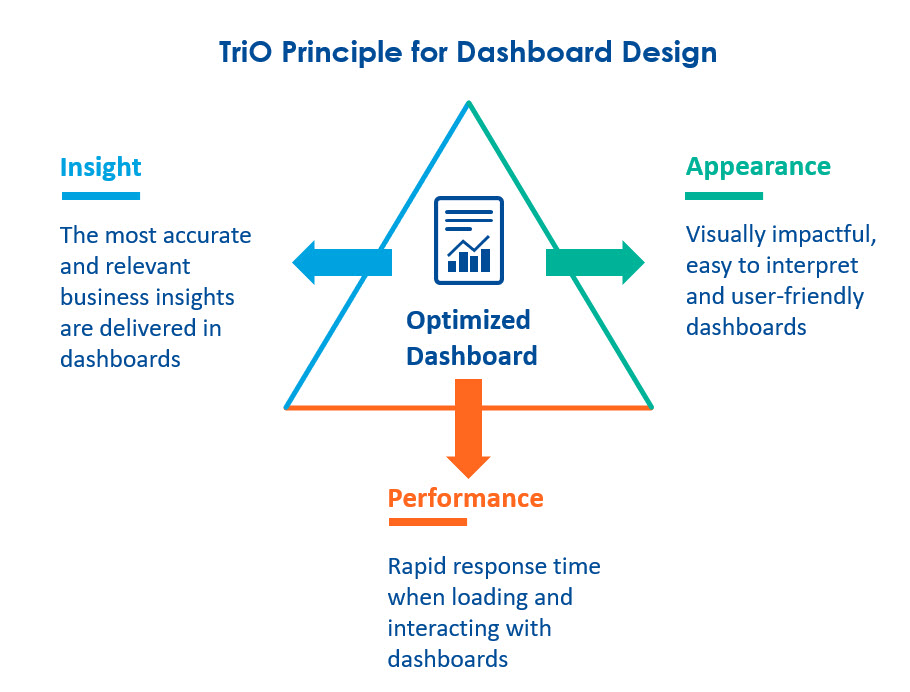
Applying our Tri-Optimization Principle (TriO), we optimize dashboards for three critical, equally weighted attributes: Insight, Performance, and Appearance.
Before designing a dashboard, we conduct a thorough assessment of your data sources, infrastructure, visualization tools, and reporting requirements. Next, we apply the TriO principle for dashboards to determine the optimal data structure and processes to maximize insight, performance, and appearance.
 Insight
Deliver more accurate and relevant business insight.
Creating dashboards that are attractive but lack insight is a lost opportunity. However, creating insightful dashboards is almost impossible when the underlying data sets are not properly organized, curated, or inter-connected. That’s why most projects require some level of ETL (extraction, transformation, and loading) for data sources to be imported and visualized.
With our dashboard optimization services, we determine the optimal data structure and processes to deliver the most accurate, insightful visualizations.
Performance
Creating faster-performance dashboards.
Studies show that when slow dashboards take longer than seven seconds to respond to queries, users grow frustrated. Rapid response time to queries is crucial, but it’s not always easy to know why a dashboard performs slowly on load or when interacted with. Query performance can be affected by how the underlying data is organized, the number of data points in the visual, the network and data storage systems, or the overall design.
Our data visualization experts have developed a 33 Point Dashboard Performance Checklist to help clients determine why their dashboards are performing poorly. Our team then recommends and implements the solutions required for exceptional dashboard performance results.
Appearance
Make dashboards visually impactful and user-friendly.
Without the proper use of visual precepts, dashboards can become confusing, slow to interpret, or even interfere with analysis and accurate decision-making. Our experts improve the visual impact and efficacy of client dashboards by adhering to industry best practices and our own standardized D3 – Dashboard Design and Development Methodology.
As part of our dashboard optimization services, we use visual science principles such as alignment, containment, position, colour, proximity, enclosure, etc. The resulting dashboards are brimming with insight and easy to understand. Transform your dashboards into powerful decision-making tools—contact us today to get started.
